HOMOVA results do not agree with what I would expect

Hi all

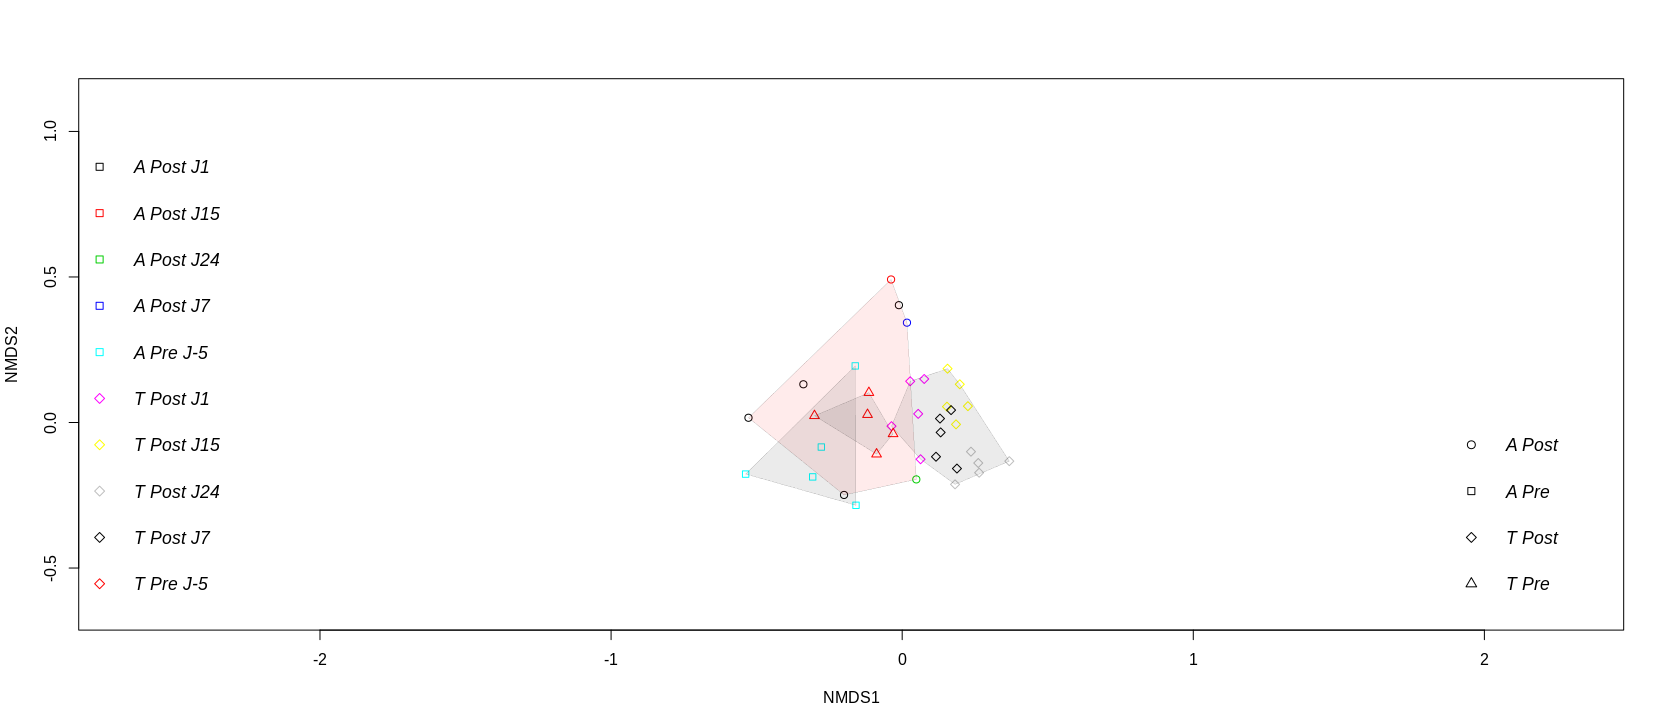
I am performing a couple of comparisons between 4 different groups. Based on NMDS ordination (braycurtis) one of my groups (red shade) seems to have a much bigger spread than the other 3 groups, the samples within seem to be more dissimilar with each other and therefore the total area covering in the NMDS seems much bigger compared to the other groups…

In the past (and using different datasets) using the observations from the NMDS I was able to nail the differences in variance using HOMOVA! Groups that seemed to have a much bigger spread when I compared them to groups with much smaller spread, molecular variance contrasts were highly significant. However, when i tried with the above dataset, not only i cannot get significant differences but according to HOMOVA the variance between A_Post and A_Pre (which is the comparison I m mostly interested) is almost similar with Pre having slightly higher variance… which doesnt make any sense…

HOMOVA  BValue  P-value SSwithin/(Ni-1)_values
 A_Post-A_Pre-T_Post-T_Pre       0.377799        0.0013* 0.145726        0.15712 0.113649        0.113902
A_Post-A_Pre    0.0087604       0.5587  0.145726        0.15712
A_Post-T_Post   0.285322        0.0011* 0.145726        0.113649
A_Post-T_Pre    0.0874525       0.0288  0.145726        0.113902
A_Pre-T_Post    0.17092 0.0788  0.15712 0.113649
A_Pre-T_Pre     0.0915804       0.044   0.15712 0.113902
T_Post-T_Pre    7.51542e-06     0.9858  0.113649        0.113902

I am wondering if I have been wrong in understanding the output of HOMOVA (which i really hope not), or if i fail to see signigificant contrasts because the groups of samples do not the same number of samples (group 1 has 5 samples, group 2 has 25 samples)

Any help is highly appreciated,
P

I suspect the difference in number of samples is part of what is driving the difference. As a test, could you get 5 samples from each group and re run the test?

OK, reduced the number of samples to the A post and that way the A Post vs A Pre was 7 x 5 samples. The values of the HOMOVA in this try showed a difference between the two groups with A Post having higher variance (as expected) but it is nowhere near significance

HOMOVA BValue P-value SSwithin/(Ni-1)_values
A_Post-A_Pre-T_Post-T_Pre 0.547366 <0.001* 0.170466 0.158019 0.110608 0.113084
A_Post-A_Pre 0.00620653 0.613 0.170466 0.158019
A_Post-T_Post 0.431756 <0.001* 0.170466 0.110608
A_Post-T_Pre 0.176773 0.005* 0.170466 0.113084
A_Pre-T_Post 0.208744 0.041 0.158019 0.110608
A_Pre-T_Pre 0.0990455 0.064 0.158019 0.113084
T_Post-T_Pre 0.000749521 0.849 0.110608 0.113084

Looking at the graph again maybe the contrast is not as clear as I thought and I think I ll leave it there (unless sb thinks that sth fishy is going on and there should indeed be a significant difference…)

Considering how HOMOVA is affected by sample size of each treatment, does it make sense to present comparisons between groups with unequal sample sizes?
Permanova for example even though it can be used to compare groups of unequal sample sizes, the comparison has to be between 2 groups…

OK last post cause this has been bugging me…

I made some more comparisons by removing/adding samples and ended up with 3 groups of samples (COMP1 with a total of 80 samples, COMP2 total of 40 samples, COMP3 total of 50 samples)
All 3 groups stem from COMP1 but in COMP2 and 3 I have semirandomly removed samples…

For each group I compared individually three factors (Ino, merg and Comp) and depending on the treatment some of the pairwise comparisons were performed between groups of equal sample size while others between groups of unequal sample size.

I summarize all results below, notice that within brackets i mention the sample size of each treatment group

COMP1

merg
HOMOVA BValue P-value SSwithin/(Ni-1)_values
A-T 0.0351767 0.56 0.333711 0.314134 (40x40)

Comp
HOMOVA BValue P-value SSwithin/(Ni-1)_values
CR-Feces-R 2.40951 0.002* 0.250407 0.143259 0.138842 (20x50x10)
CR-Feces 2.25088 0.001* 0.250407 0.143259
CR-R 0.939969 <0.001* 0.250407 0.138842
Feces-R 0.00356602 0.994 0.143259 0.138842

Ino
HOMOVA BValue P-value SSwithin/(Ni-1)_values
Post-Pre 0.0788148 0.382 0.312923 0.347493 (60x20)

COMP2
merg
HOMOVA BValue P-value SSwithin/(Ni-1)_values
A-T 0.0295373 0.048* 0.387175 0.357444 (20x20)

Comp
HOMOVA BValue P-value SSwithin/(Ni-1)_values
CR-Feces-R 1.49031 <0.001* 0.25017 0.138406 0.140344 (20x10x10)
CR-Feces 0.946677 <0.001* 0.25017 0.138406
CR-R 0.904632 <0.001* 0.25017 0.140344
Feces-R 0.000411883 0.663 0.138406 0.140344

Ino
HOMOVA BValue P-value SSwithin/(Ni-1)_values
Post-Pre 0.0190304 0.119 0.325915 0.347501 (20x20)

COMP3
merg
HOMOVA BValue P-value SSwithin/(Ni-1)_values
A-T 0.00329337 0.536 0.365988 0.357224 (30x20)

Comp
HOMOVA BValue P-value SSwithin/(Ni-1)_values
CR-Feces-R 1.90405 <0.001* 0.250255 0.139687 0.139926 (20x20x10)
CR-Feces 1.55168 <0.001* 0.250255 0.139687
CR-R 0.914588 <0.001* 0.250255 0.139926
Feces-R 8.55373e-06 0.987 0.139687 0.139926

Ino
HOMOVA BValue P-value SSwithin/(Ni-1)_values
Post-Pre 0.0363783 0.056 0.376494 0.347297 (30x20)

Here are some thoughts
The Ino comparisons do not make sense.
Here is the bray-curtis NMDS for COMP1 using Ino to group samples (gray/red ellipses)

and here for COMP3

Notice the difference in spread of samples based on the red and gray ellipses
That I would have expected to be detected by HOMOVA, but it didnt and reducing the number of samples in treatments didnt help either (even though it brought the pvalue close to significance)

However, take a look at the Comp comparisons (CR vs Feces vs R)
They always are highly significant
Here is the bray-curtis NMDS for COMP1 using Comp to group samples (green/gray/red or gray/red ellipses)

here for COMP2

and here COMP3

The first thing that crossed my mind is that here (using the Comp factor), HOMOVA works well, regardless if the numbers of samples per treatment is equal or unequal, simply because the centroids of each treatment are not close to each other…

Could that be the case? And if yes that would mean that HOMOVA can only be used if AMOVA or Permanova are significant?

Really curious to hear other peoples’ thoughts

This topic was automatically closed 10 days after the last reply. New replies are no longer allowed.